Complete Guide to RestaurantTable Tracking Systems?
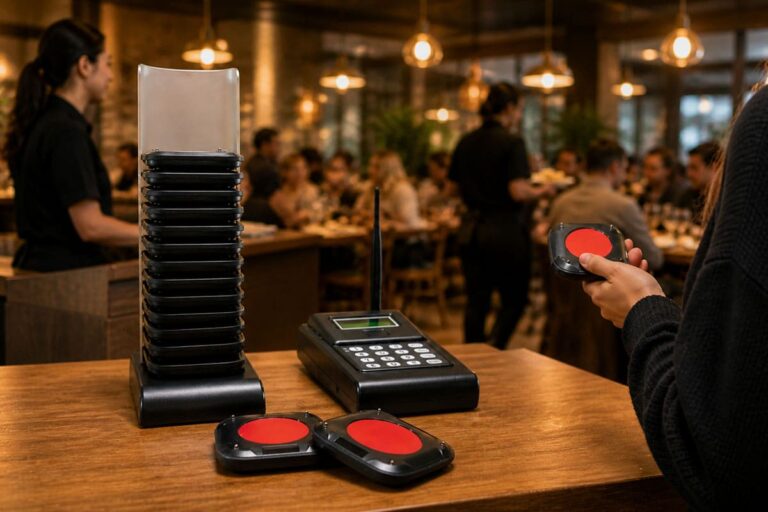
Food went to wrong tables. Runners walked in circles. My first BLE table tracking install stalled. The fix was not range. It was charging, battery, and tight SOP.
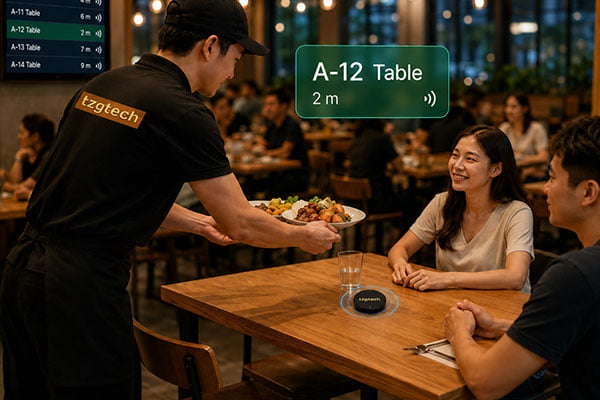
A table tracking system uses BLE tags and gateways to help food find the right table fast and reliably. I treat it as an operations reliability system. It works in single-floor, open halls, with strict charging and battery SOP, proven by a one‑week peak pilot.
I learned the hard way. I first bought for features. I later bought for reliability. If you want fewer misdeliveries and faster turns at peak, keep reading. I will show the exact metrics, the failure mode that bit me, and the pilot that stopped wishful thinking.
What job does table tracking really do?
Wrong food hurts trust. Slow turns hurt sales. My team once carried trays twice to fix mistakes. The tech did not fix it because we chased features, not outcomes.
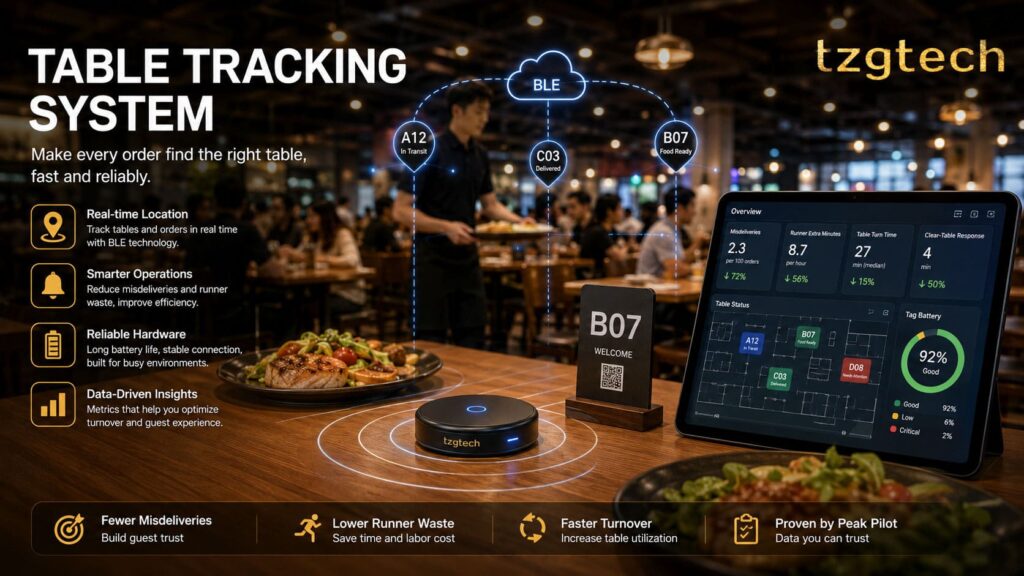
Table tracking should do one job: make sure food reaches the right table quickly and reliably. Measure two things first: misdelivery and runner minutes, and table turn and clear-table response. Build acceptance around these outcomes.
Dive deeper
I no longer call this a “guest paging” tool. I frame it as an operations reliability system. That one shift changed my buy and my rollout. I am not an RF engineer. I am an operator. I map every feature to two outcomes that I can count every day.
The outcomes that matter
- Misdelivery rate and runner waste minutes
- Table turn time and clear-table response at peak
Mapping features to outcomes
- Location confidence maps to fewer misdeliveries.
- Tag reliability maps to lower offline rate and fewer delays.
- UI clarity maps to faster runner dispatch and shorter turns.
| Metric | Before pilot (peak) | After rework (peak) | Target for acceptance |
|---|---|---|---|
| Misdeliveries per 100 orders | 6–8 | 2–3 | ≤3 |
| Runner extra minutes per hour | 18–22 | 6–10 | ≤10 |
| Table turn time (median, minutes) | 31–34 | 26–28 | ≤28 |
| Clear-table response (minutes) | 7–9 | 3–5 | ≤5 |
| Tag offline rate during peak | 10–15% | 3–5% | ≤5% |
I track these with a simple sheet. I do not accept a rollout if these numbers do not move. I put this in the SOW. The system only “works” when these outcomes move in the real store, not in a demo.
When does BLE table tracking fit and when should I pass?
At first, I trusted “max meter” claims. That was a mistake. Floor plans, partitions, and turnover pace drove results, not lab range.
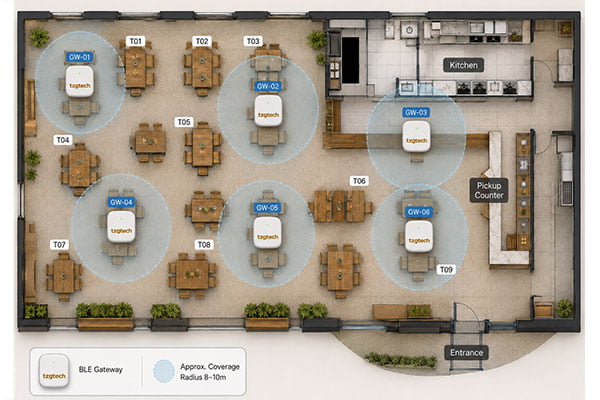
BLE table tracking has worked best for me in single-floor, open halls with minimal partitions and fast turnover. It struggles in multi-floor sites or heavy steel and glass zones. If your layout is complex, validate or choose another tech.
Dive deeper
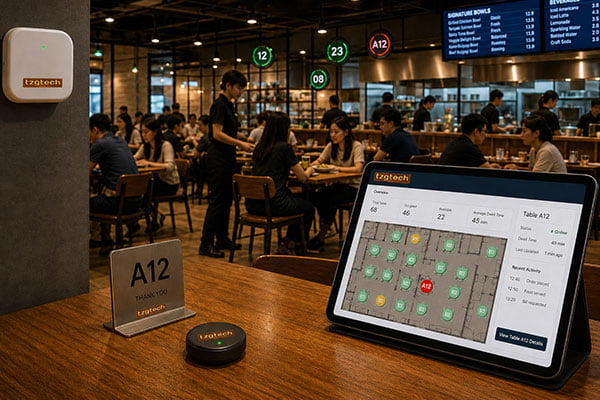
I run a large, open hall with more than 80 tables at peak. BLE tags and a few gateways covered it well. I tried the same stack in a split-level site with thick partitions. The offline rate rose at peak and stayed high. I learned to define fit before I buy.
Fit checklist (my rule-of-thumb, not lab science)
- Single floor, open view lines
- Few tall partitions or metal/glass walls
- Dense seating, fast turns, queue at counter
- Stable power and stable network for gateways
- Staff able to charge and rotate tags every shift
| Factor | Good fit (BLE) | Risk or pass (needs validation) |
|---|---|---|
| Floors | Single | Multi-floor, mezzanines |
| Partitions | Low dividers, light wood | Heavy metal/glass, mirrors, thick walls |
| Seating density | High, >80 tables at peak | Sparse seating, far spread |
| Service style | Counter service, fast turnover | Full service with long dwell and many obstructions |
| Power/network | Stable, protected from unplug events | Frequent resets, shared power strips |
| Staff SOP discipline | Strong charging/rotation habits | Inconsistent SOP, high turnover |
Edge cases I treat with care
- Private rooms and alcoves. I test tags in those corners.
- Busy kitchens with steel near gateways. I move mounts and test again.
- Outdoor patios. I validate weather and seating flow first.
If any of these show risk in a quick walk test, I do a focused pilot or choose other tech. I do not accept “it will be fine.” I need logs from the floor.
Why do charging contacts and batteries break these systems?
My first failure looked like “range.” Tags dropped offline at dinner. Runners blamed signals. The real issue was not RF. It was dirty contacts, poor seating, and tired batteries.
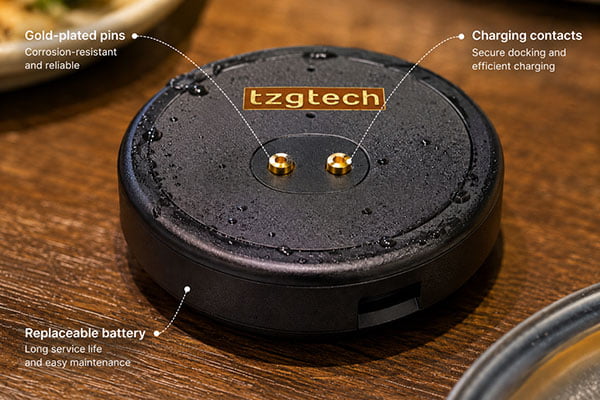
Most real drop-offs come from charging and battery aging, not range. Fix charging dock reliability, battery replacement, and low-battery alerts. Write these as non-negotiables in RFQs, plus SOPs for daily wipes and weekly checks.
Dive deeper
I lost hours chasing ghosts. We moved gateways. We changed channels. Nothing stuck. Then I looked at the docks. Contacts were dull and pitted. A few tags sat loose. Battery capacity had faded. After rework, the offline rate fell from about 10–15% to 3–5% at peak. The fix was simple, but only if we made it a rule and not a “nice to have.”
Non-negotiables I now put in every RFQ
- Charging dock/contact reliability: life-cycle proof and corrosion tests.
- Replaceable batteries: standard cells, not glued packs.
- Low-battery alerts: visible in the dashboard and on device if possible.
- Hot-swap plan: spare tags and spare contact modules in the kit.
- Clear wear parts list: contacts, springs, feet, covers.
| Failure mode | Symptom on floor | Control I require |
|---|---|---|
| Contact corrosion | Tag shows “offline” after charge | Gold plating spec and salt-spray test report |
| Poor seating in dock | Random battery drops overnight | Dock click/guide design and seating test |
| Battery capacity fade | Short run time at peak | Replaceable cell + capacity spec + spares |
| Dirty dock/grease | Intermittent charging | SOP: daily wipe + weekly cotton swab check |
| No low-battery signal | Surprise shutdowns | Visible alert + log export for rotation |
SOP that sticks for my team
- Daily: quick wipe of contacts and docks during close.
- Weekly: deep clean of docks; check spring tension.
- Rotation ledger: mark A/B/C battery pools; rotate weekly.
- Low-battery queue: swap flagged tags before lunch peak.
- Spare pool: keep 10% tagged as hot spares.
I keep the SOP simple and visual. I post it in the back room. I track five minutes of maintenance per shift. If that number climbs, I check docks, not gateways.
How should I run a one‑week peak pilot that tells the truth?
I once ran a two-hour demo. It looked great. The rollout failed at the next weekend rush. Short demos hide the pain.
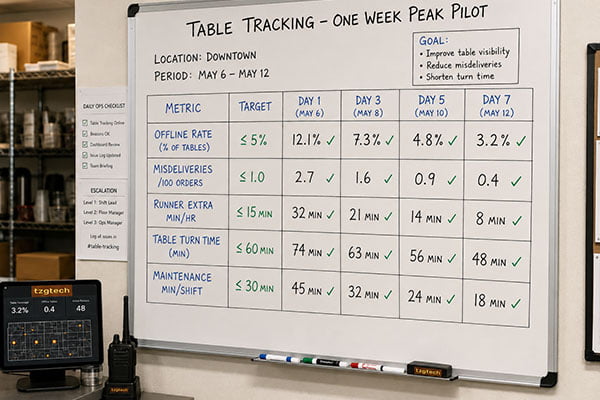
Run a seven-day pilot that covers peak hours. Log offline rate, misdelivery, runner minutes, table turn, and maintenance minutes. Set hard thresholds. Accept or reject on the numbers. Write those numbers into the contract and the SOP.
Dive deeper
A real pilot changed my process. I planned seven days that covered our true peaks. I used simple sheets. I included maintenance minutes, which I had never tracked. I learned that a system can look fine when idle and then fall apart under load. After we fixed charging and battery rotation, the same tags passed the pilot.
Data I collect
- Offline rate during lunch and dinner peaks
- Misdeliveries per 100 orders
- Runner extra minutes per hour (detours, dead walks)
- Median table turn time and clear-table response
- Maintenance minutes per shift
Daily rhythm
- Start: verify gateway power and network. Check spares.
- Mid-peak: quick offline scan and battery alert sweep.
- End: export logs, fill sheet, wipe docks, rotate batteries.
| Metric | Threshold to accept | Day 1–2 (pre-fix) | Day 5–7 (post-fix) |
|---|---|---|---|
| Offline rate (peak) | ≤5% | 10–15% | 3–5% |
| Misdeliveries per 100 orders | ≤3 | 6–8 | 2–3 |
| Runner extra minutes/hour | ≤10 | 18–22 | 6–10 |
| Median table turn time (min) | ≤28 | 31–34 | 26–28 |
| Maintenance minutes/shift | ≤15 | 28–35 | 8–12 |
Go/No‑Go gates I use
- Hit all thresholds on two peak days in a row.
- Finish the week with no more than one tag swap due to low battery outside SOP.
- Provide log exports to attach to the acceptance memo.
I keep the pilot honest. If the numbers do not hold on peak days, we do not roll out. We fix, retest, and only then move forward.
What should I lock into my RFQ and SOW with vendors?
I once wrote a vague RFQ. I got a shiny demo and weak docks. I paid twice. I now write the messy details up front.
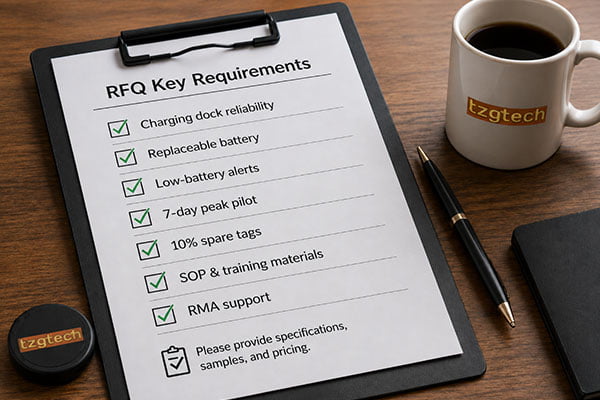
Lock charging and battery requirements, pilot metrics, and SOP materials into the RFQ and SOW. Ask for life-cycle tests, corrosion tests, low-battery alerts, spares, and a one‑week peak pilot with pass/fail thresholds.
Dive deeper
I speak as an operator, not an engineer. I do not ask for lab range. I ask for things my floor team can keep alive. I ask for test reports that match what fails in stores. I ask for a pilot plan that the vendor supports. This sets the tone. It also saves us both rework.
RFQ clauses that changed my results
- Charging dock/contact: life-cycle spec (≥10k insertions), corrosion test report, replaceable contact modules.
- Battery: replaceable cell, capacity spec, low-battery alert in software, battery change guide.
- Spares: 10% spare tags, contact kits, and at least one spare dock per 20 tags.
- Pilot: seven days over peaks, metrics logged, thresholds as acceptance gates.
- Deliverables: visual SOP cards, training videos, maintenance checklist templates, log export format.
| Area | Clause summary | Evidence I ask for |
|---|---|---|
| Charging | Gold-plated contacts, seating guide, replaceable modules | Photos, test report, spare SKU list |
| Battery | User-replaceable, capacity spec, alert integration | Data sheet, UI screenshot of alerts |
| Reliability | Offline rate target ≤5% at peak in pilot | Pilot logs and signed summary |
| Support | Training, SOP, and maintenance materials provided | PDF cards, link to videos |
| Spares | 10% spares and contact kits included in initial shipment | Packing list with quantities |
SOW extras that help my team
- On-site kickoff: dock placement plan and power backup plan.
- Weekly check-in during the first month after rollout.
- Clear RMA path for docks and tags with contact issues.
When these points live in the contract, we get fewer surprises. We also get a smoother handoff from install to daily use.
Conclusion
Treat table tracking as an operations reliability system. Buy for maintainability and SOP. Prove it with a one‑week peak pilot. Fix charging and battery. Then scale with confidence.