Complete Guide to RestaurantTable Tracking Systems?
Food runners hunt tables. Orders go cold. Managers blame radios. I saw this many times. I fixed it with event-driven table tags and simple swap-and-charge routines.
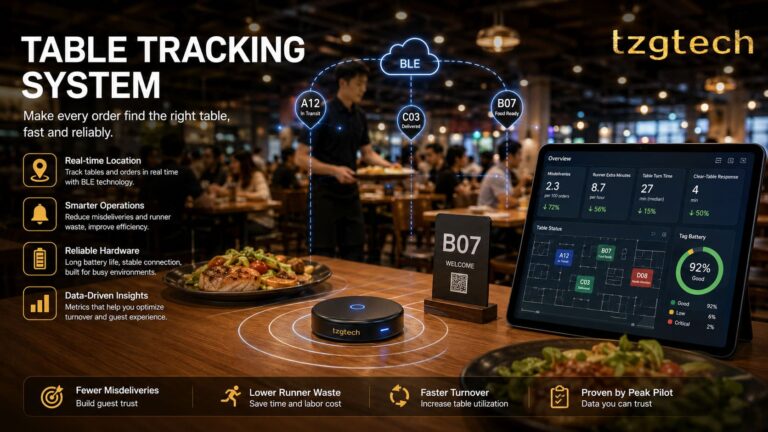
A restaurant table tracking system should run on events, not continuous location1. Map your service flow to a few triggers. Design closed loops for charging and loss. Prove event reliability in one pilot store. You can then hit delivery and mis-serve targets with lower cost and less risk.

I learned that RF specs do not save a rush. Clear events and simple routines do. In this guide, I share what worked and what failed. I show checklists, numbers, and placements you can test in one afternoon. I keep it honest, and very practical.
Is table tracking about events, not live location?
Teams chase meter-level accuracy2. Costs rise. Service still slips. I faced this pressure. I pivoted to events. I cut data noise. Runners got clear signals. Wrong-table runs dropped.
Focus on a short list of triggers: seated, order ready, runner pickup, delivered, and bussing. Define success by event delivery and timing. Place triggers where hands already go. You will guide behavior, reduce errors, and remove the need for continuous location.

Map service models to triggers
I build OEM/ODM systems for different formats. I start by mapping the flow to events. Fewer events mean fewer misses and less training. Here is the pattern I use.
| Service model | Core triggers | Who must get event | Timing target (s) |
|---|---|---|---|
| Full-service | Seated, Order ready, Runner pickup, Delivered, Bussing | Host, Kitchen pass, Runner, Server | 2–5 to each station |
| QSR with runners | Order ready, Runner pickup, Delivered | Runner, Guest screen, Manager | 2–3 at pass; 3–5 to runner |
| Food court | Order ready, Guest arrived, Delivered | Counter staff, Guest screen | 2–3 at counter |
Define success by delivery and timing
I state success as “the right person sees the right event within N seconds.” I aim for >98% event success and <3 seconds3 at the pass. I ignore meter claims. I track wrong-table and re-run counts instead.
Trigger placement and behavior
Placement changes behavior. A tag on the table edge makes a quick tap easy. A pass-window button sits where hands already go. A runner badge confirms pickup. In one pilot, we hid tags under metal tops. Events dropped. Staff started guessing. We moved tags to the edge. Events fired on time, and wrong-table runs fell fast.
Why do charging, cleaning, and loss control decide TCO?
Budgets die after pilots. Not because tags fail. Because chargers tangle, batteries die, and tags vanish. I learned this the hard way. I built closed loops that stores could run.
Model TCO around four drivers4: charging cadence, loss rate, cleaning exposure, and spares pool. Set swap routines and targets before the pilot. Judge feasibility against labor minutes per 100 tags, not unit price.

Build a simple model you can run
I use a small table at kickoff. It keeps the team honest.
| Driver | Typical range I saw | Setup choices | Pilot target |
|---|---|---|---|
| Charging cadence | Shift-based to 7 days | Pooled rack vs on-table charging | Swap once per shift or less |
| Loss/misplacement | 0.3%–3% per month5 | Visual ID, QR return, anchor points | ≤1% per month |
| Cleaning exposure | Oil film, sanitizer, steam | Sealed tags, chemical-safe mounts | Zero liquid ingress6 |
| Spares pool | 5%–15% | Central rack, labeled bins | ≤10% with fast swap |
| Labor minutes/100 tags | 10–40 per shift | Batch swaps, zone racks | ≤20 minutes |
Practical mechanisms that work
I standardize a rack near the pass. I keep spares and chargers in one visible place. I label tags with large IDs and QR codes for reunite-and-return. I pick mounts that survive oil and sanitizer. I write a swap routine by shift, with names and times. I log minutes spent per 100 tags, not stories. In one chain, loss sat near 3% per month. We added bright IDs and a return cup at the host stand. Loss dropped below 0.7% in two weeks. On-table charging looked neat in a demo. It slowed cleaning in service. We went back to pooled racks. Staff thanked us.
How do real kitchens break max-range claims?
Spec sheets promise long range. Kitchens cancel that. Metal, bodies, steam, and oil block or detune signals. I saw perfect lab links die at lunch. I changed placement, not radios.
Do a one-afternoon sanity test. Run during peak. Check event success rates at pass window, corners, and under metal tables. Wipe with cleaner. Move tags to edges if metal blocks them.

Why metal and people matter
Metal tables and rails reflect and detune antennas7. Human bodies absorb signals8. Steam and heat shift performance9. Oil film creeps into seams and buttons10. This is why “max range” drops at rush. I stopped chasing dB. I moved devices to clear edges and hand paths.
The stress tests I run
I run tests in one afternoon. I trigger 100 events at the pass window during peak. I log success and time. I walk to far corners and repeat. I try under-table, on-edge, and near cutlery tubs. I wipe with the real sanitizer. I note any stick, leak, or drop.
| Hazard | Symptom in field | Simple fix that survived |
|---|---|---|
| Metal table underside | Missed events at rush | Mount at table edge; use plastic standoff |
| Bodies between tag and pass | Dropouts when crowded | Add pass anchor; raise receiver height11 |
| Oil film and cleaner | Button sticks; detune | Sealed tags; chemical-safe gaskets; weekly wipe SOP |
| Heat/steam near pass | Battery and adhesive fail12 | Offset from heat by 20–30 cm; high-temp adhesive |
A placement story that changed results
In one busy store, under-table tags missed 15% of “delivered” taps at lunch. We moved tags to the edge, away from metal, at the same height. Success jumped to 99%. We also raised the pass receiver by 30 cm. Runners stopped repeating taps.
What pilot-to-rollout blueprint works for chain ops?
Many pilots look good. Rollouts then fail. The gap is SOP and gating. I now run pilots like rehearsals for scale. I document who does what, when, and where.
Pick one high-traffic store. Split into zones. Set clear KPIs. Log every swap, loss, and cleaning issue. Start with light data paths. Scale only after two steady weeks hitting event and operations targets.

Pilot design with zones and KPIs
I pick a store with three zones: metal tables, wood tables, and far corners. I place triggers at the pass, runner station, and table edge. I track on-time delivery, mis-serve rate, runner dwell, event success, loss, and swap minutes. I keep a daily log. I ask staff to note pain in their own words. In one pilot, wrong-table runs were rare in the morning but spiked at lunch. The event log showed missed “pickup” at the pass. We changed the button angle and added a small label. The spike vanished.
Data path first, integrations later
I start with exports, webhooks, or a light dashboard. I prove cadence and behavior first. I avoid deep POS/KDS work until the team can run swaps and charging with no drama. When events are solid, we discuss data joins. Some sites later keep the light path. That is fine.
Rollout gates and SOPs you can audit
I scale only after two weeks of steady scores. I write simple SOPs with names and times. I use a short gate table.
| KPI | Gate to pass | Evidence |
|---|---|---|
| Event success | ≥98% within 2–5 s at pass | 2-week log |
| On-time delivery | ≥90% within service promise | Time stamps |
| Mis-serve rate | ≤0.5% of orders | Runner log |
| Loss rate | ≤1% per month | Tag inventory |
| Swap labor | ≤20 minutes per 100 tags per shift | Staff sheet |
| Cleaning issues | Zero ingress or stuck buttons | Wipe test notes |
I keep spares in a labeled bin at the rack. I state who swaps, when, and where. I add a weekly check for IDs and mounts. In one rollout, we moved tags from under-table to edge mounts before week one. Event reliability was steady from day one. Training took 20 minutes per shift. The chain was ready to scale.
Conclusion
Design events, not locations. Close the loops for charging and loss. Prove reliability in one pilot store. Then scale with SOPs. This path cut errors and cost in my projects.
"[2510.04404] Next-Generation Event-Driven Architectures - arXiv", https://arxiv.org/abs/2510.04404. Surveys of event‑driven architecture in IoT report lower communication overhead and better scalability than continuous polling or streaming approaches, supporting the idea that an event‑based design can be more efficient for tracking workflows; however, these surveys address IoT systems in general rather than restaurant table tracking specifically. Evidence role: general_support; source type: research. Supports: That event-driven architectures in IoT typically reduce overhead and improve scalability compared with continuous polling/streaming of state, making them suitable for systems like tracking workflows.. ↩
"[PDF] A Survey of Indoor Localization Systems and Technologies - arXiv", https://arxiv.org/pdf/1709.01015. Comprehensive reviews of indoor localization technologies conclude that sustaining meter‑level accuracy in real environments is difficult due to multipath, blockage, and calibration demands, and may require dense infrastructure or specialized methods; these findings are general to indoor environments and not specific to restaurants. Evidence role: expert_consensus; source type: research. Supports: That literature on indoor positioning finds consistent meter‑level accuracy in complex, metal‑rich, crowded environments to be challenging and often requiring costly infrastructure or calibration.. ↩
"An Analysis of the Effects of Smartphone Push Notifications on Task ...", https://pmc.ncbi.nlm.nih.gov/articles/PMC4912993/. Human–computer interaction references note that response times under about 1–3 seconds preserve users’ flow and sense of immediacy, providing a rationale for targets in this range; these are general usability guidelines rather than empirical restaurant operations data. Evidence role: expert_consensus; source type: encyclopedia. Supports: That human–computer interaction guidance places meaningful thresholds for perceived immediacy in the 1–3 second range.. ↩
"Life Cycle Costing - Integrated Asset Management Framework", https://swefc.unm.edu/iamf/life-cycle-costing/. References on total cost of ownership describe lifecycle costs beyond purchase price, including maintenance, consumables, downtime, and losses, consistent with modeling charging, cleaning exposure, loss, and spares as TCO drivers; these are conceptual definitions rather than restaurant‑specific data. Evidence role: definition; source type: encyclopedia. Supports: That TCO frameworks in operations include ongoing maintenance, consumables, losses, and spare inventory as cost drivers.. ↩
"Real-time location system-based asset tracking in the healthcare field", https://pmc.ncbi.nlm.nih.gov/articles/PMC6131815/. Sector‑level surveys (e.g., retail shrink on the order of 1–2% of annual sales) and healthcare reports on equipment misplacement indicate persistent asset loss and unavailability, which contextualizes low single‑digit loss rates; these figures are not direct measurements of tag disappearance in restaurants. Evidence role: general_support; source type: institution. Supports: That ongoing loss/misplacement of assets is a recognized operational issue in sectors like retail and healthcare, providing context for non‑zero monthly loss rates.. ↩
"IP code - Wikipedia", https://en.wikipedia.org/wiki/IP_code. The IEC 60529 IP Code defines standardized protection levels against liquid ingress (e.g., spray, immersion), offering a formal basis for specifying ‘zero liquid ingress’ requirements; the standard prescribes laboratory tests rather than field performance. Evidence role: definition; source type: encyclopedia. Supports: That the IP Code (IEC 60529) formalizes degrees of protection against liquid ingress, providing a standard reference point for such targets.. ↩
"[PDF] antennas.pdf", https://courses.physics.illinois.edu/phys525/sp2025/units/antennas.pdf. Antenna engineering course notes explain that proximity to conductive objects alters an antenna’s input impedance and radiation pattern, effectively detuning it and increasing reflections; this is a general RF mechanism, not a kitchen‑specific measurement. Evidence role: mechanism; source type: education. Supports: That antennas placed close to conductive structures (e.g., metal tables or rails) experience impedance and pattern changes that can detune and degrade performance.. ↩
"Analysis of Human Body Shadowing Effect on Wireless Sensor ...", https://pmc.ncbi.nlm.nih.gov/articles/PMC6211019/. Empirical studies of 2.4 GHz propagation report notable body shadowing and absorption, with human presence measurably attenuating Bluetooth and Wi‑Fi signals; quantitative impact varies by posture, crowd density, and environment. Evidence role: mechanism; source type: research. Supports: That peer‑reviewed studies observe significant attenuation and shadowing of 2.4 GHz links caused by the human body.. ↩
"[PDF] RECOMMENDATION ITU-R P.676-13 - Attenuation by atmospheric ...", https://www.itu.int/dms_pubrec/itu-r/rec/p/R-REC-P.676-13-202208-I!!PDF-E.pdf. International radio‑propagation recommendations (e.g., ITU‑R) document gaseous absorption by water vapor at microwave frequencies, implying additional attenuation in steamy or humid conditions; the guidance is general and not measured in a specific kitchen. Evidence role: mechanism; source type: institution. Supports: That radio propagation models include gaseous (water vapor) absorption at microwave frequencies relevant to Wi‑Fi/Bluetooth.. ↩
"[PDF] NIOSH Manual of Analytical Methods (NMAM), 5th Edition - CDC", https://www.cdc.gov/niosh/nmam/pdf/NMAM_5thEd_EBook-508-final.pdf. Government occupational health reports describe aerosolized grease and oil from commercial cooking that deposits on surfaces and equipment, supporting the plausibility of oil contamination affecting seams and buttons; such reports address kitchen environments generally and do not test a particular device. Evidence role: mechanism; source type: government. Supports: That commercial cooking generates aerosolized grease/oil that deposits on nearby surfaces and equipment, posing contamination risks.. ↩
"Overview of techniques for mitigation of fading and shadowing in the ...", https://ntrs.nasa.gov/citations/19960022524. Radio propagation references explain that improving antenna height and Fresnel zone clearance reduces obstruction losses and body shadowing, which can stabilize links in crowded spaces; this is a general propagation principle rather than a measurement from the described site. Evidence role: mechanism; source type: encyclopedia. Supports: That antenna height and Fresnel zone clearance reduce obstruction and multipath losses.. ↩
"Heat Generation and Degradation Mechanism of Lithium-Ion ...", https://pmc.ncbi.nlm.nih.gov/articles/PMC9753165/. Materials and electrochemistry studies show that elevated temperatures accelerate lithium‑ion battery aging and that many pressure‑sensitive adhesives lose strength or soften with heat, supporting the stated failure risks near hot passes; exact thresholds depend on the specific battery chemistry and adhesive formulation. Evidence role: mechanism; source type: research. Supports: That higher temperatures accelerate Li‑ion battery aging and reduce the mechanical performance of many adhesives.. ↩